You are using an out of date browser. It may not display this or other websites correctly.
You should upgrade or use an alternative browser.
You should upgrade or use an alternative browser.
Dyno Results
- Thread starter Mike4x4
- Start date

Help Support Nissan Navara Forum:
This site may earn a commission from merchant affiliate
links, including eBay, Amazon, and others.
joe2006
Member
Can't help but interesting how the lines cross.
gunning1987
Member
look around 930 ftlb which is over 1000nm somethings not right here, 4th gear is also selected and to my knowledge is a overdrive so its multiplying the torque.
But this is with no knowledge of dyno's and how they actually work.
But this is with no knowledge of dyno's and how they actually work.
Busiboy
Member
Makes it hard when power and torque are the same colour . . . .
920 lb
920 lb
Last edited:
K
Krankin
Guest
Nqr

$132.98
WJXMZDM 4pcs Window Visors Rain Guards for Nissan NAVARA D22 MK1-D22 1997-2001 2002 2003, Window Deflectors Window Rain Guards Vent Window Visors Car Accessories
yuanpingshixiangyouqianshangmaoyouxiangongsi

$29.98
$45.00
Nissan Navara Pathfinder (86 - 96)
Classic Automotive Repair Shop & Restoration Manuals

$63.00
$67.00
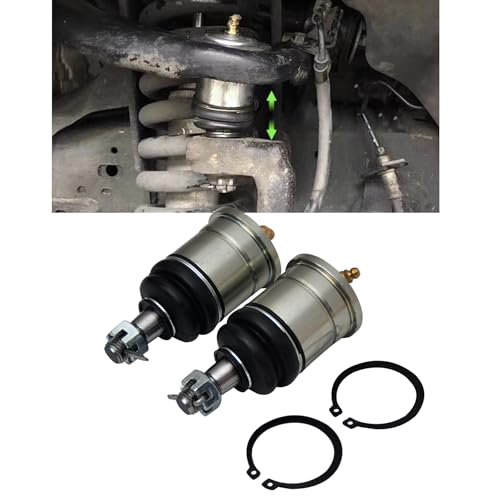
Lift Ball Joint Fit forNissan NAVARA D40 2005-2014 / Navara NP300 D23 2015-2023 / Frontier 2005-2021
Great Automotive Technology Guangzhou Co., Ltd

$133.98
WJXMZDM 4pcs Window Visors Rain Guards for Nissan NAVARA D40 MK2-D40 2005-2011 2012 2013, Window Deflectors Window Rain Guards Vent Window Visors Car Accessories
yuanpingshixiangyouqianshangmaoyouxiangongsi
bsp
Member
- Joined
- Jun 3, 2012
- Messages
- 60
- Reaction score
- 0
Yea I'm with the others, hard to compare as we would have to know how Nissan tested to be accurate.
Having said that its possible (wont be completely accurate).
What tyre size are you running?
If I look at the graph down the bottom it says you were in 4th gear. I would have done the test in 5th as in the d40 5th is 1:1. You will have a torque multiplier being in 4th (ie the graph will show more torque) so we will need to take into consideration 4th gear ratio (but can't take into account fractions etc!)
mr1jz
Member
- Joined
- Oct 23, 2012
- Messages
- 121
- Reaction score
- 0
@mike.
Ring the shop and get them to re print it with the estimated engine torque.
The number is LBS is what we used to call dyno torque which is great when you are comparing exactly that.
Also ask them if they can change the scale so that the curves don't cross over so much.
Ring the shop and get them to re print it with the estimated engine torque.
The number is LBS is what we used to call dyno torque which is great when you are comparing exactly that.
Also ask them if they can change the scale so that the curves don't cross over so much.
joe2006
Member
I assumed they were the before and after HP figures.
K
Krankin
Guest
I reckon you could be right there, and it seems to add up,
unlike the unrealistic torque figure of over 1000Nm.
unlike the unrealistic torque figure of over 1000Nm.
K
Krankin
Guest
, 4th gear is also selected and to my knowledge is a overdrive so its multiplying the torque.
4th gear in a manual would be 1:1, 5th overdrive
This graph looks like a "power" graph only. In a stock D40, for example, peak torque is reached at 2,000rpm (with max horsepower around 3,500rpm) and this graph doesn't have anything near that combination - my guess is it's a HP graph, and we shouldn't be reading the right-hand axis.
Last edited:
bsp
Member
- Joined
- Jun 3, 2012
- Messages
- 60
- Reaction score
- 0
had another look at them this morning when i was bored at work and they are both power graphs. torque graphs (especially on diesels) are a lot flatter.
whether he backed out of the first run or made some changes between runs you'll have to ask him.
Would be better to do it in 5th gear too IMO (1:1 in D40).
Cheers
Brad
whether he backed out of the first run or made some changes between runs you'll have to ask him.
Would be better to do it in 5th gear too IMO (1:1 in D40).
Cheers
Brad


